|
|
 |
|

|
|

|
|
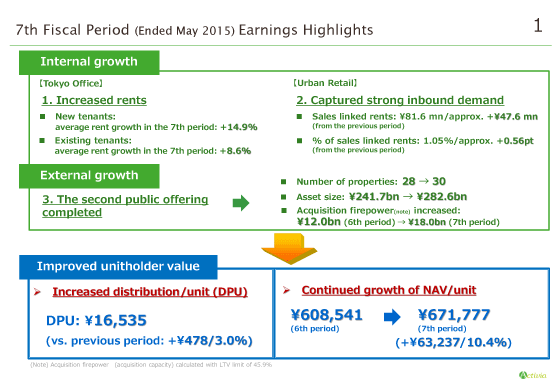
This slide shows the highlights of financial results for 7th fiscal period.
We could achieve improving unitholders' value through the growth of DPU and NAV per unit taking advantage of internal growth in recovering Tokyo office leasing market and increasing inbound demand of foreign visitors as well as external growth through the second public offering.
In terms of Internal growth, in Tokyo Office properties, we achieved rent-increase by 14.9% in average through tenant turn-over and by 8.6% in average through rent-revision with tenants.
In the Urban-Retail properties, thanks to good inbound demand from foreign visitors, sales linked rents has largely increased to approximately ¥81.6 million which is 2.4 times as large as the previous period. The ratio of sales linked rents in whole rents has also increased to 1.05% which is 1.8 times as large as the previous period.
Regarding the external growth, we completed the second public offering in the 7th fiscal period. The number of properties has increased from 28 to 30, the asset size has increased from ¥241.7 billion to ¥282.6 billion, while our additional acquisition capacity has increased to ¥18 billion at the end of 7th fiscal period.
Through the above internal and external growth track record, DPU has increased by ¥478 (3.0% up than the previous period) to ¥16,535 and NAV per unit has grown to ¥671,777 (over 10% higher than the previous period).
Please turn over the page.
|
|
|