|
|
 |
|

|
|

|
|
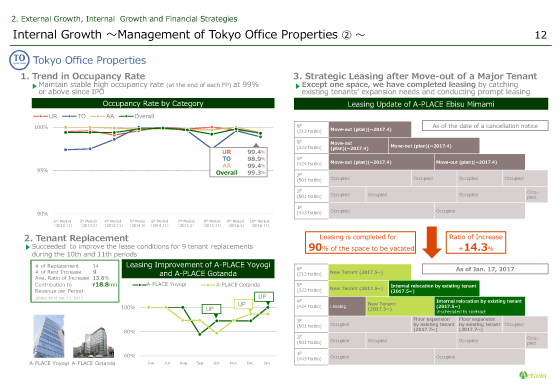
Chart 1. at the top left shows the historical occupancy rates by asset category. At the end of the 10th period, the occupancy rate of overall portfolio was 99.3%, Urban Retail Properties as 99.4%, Tokyo Office Properties as 98.9% and Activia Account Properties as 99.4%. The overall occupancy rate at every end of each fiscal period reached more than 99% since IPO.
Table 2. at the bottom left shows the status of tenant replacement. The number of tenant replacements during the 10th and 11th periods stands at 14, including nine replacements in which lease conditions were improved. The average rent increase rate is 13.6%, which resulted in the contribution to revenue by ¥18.8 million per period.
Chart 3. on the right breaks down our strategic leasing at A-PLACE Ebisu Minami, the property from which a large-lot tenant will exit. While we were notified of an intention to terminate the contract by the tenant occupying about 40% of the total leasable floor of the property in October 2016, leasing activities for 90% of the area to be vacated has already been completed because of our understanding of the existing tenants’ needs for floor expansion based on our relationships with tenants, and pre-leasing activities. The average rent increase rate associated with such tenant replacement was 14.3%, simultaneously lease conditions were improved given this opportunity.
Please turn to the next page.
|
|
|