|
|
 |
|

|
|

|
|
I would like to explain about the trend of our hotels.
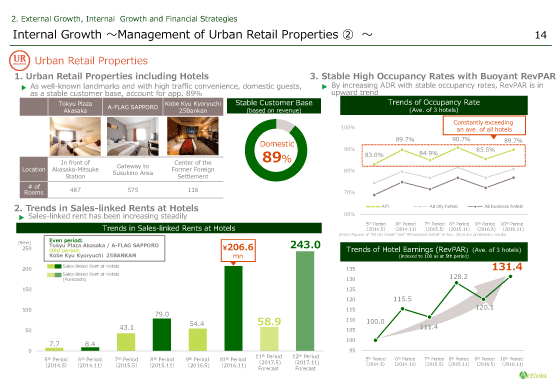
Three of our Urban Retail Properties contain hotel sections. All of these three are well-known landmarks and enjoy great traffic convenience. The ratio of domestic guests who are expected to create stable demand accounts for 89% of total revenues.
Bar chart 2. at the bottom left shows the historical trends in sales-linked rents at hotels. Comparisons between the odd number periods and the even number periods show the strong performance. The sales-linked rents for the 10th period amounted to ¥206.6 million. It is expected that such rents continue to increase, at ¥58.9 million and ¥243 million for the 11th period and the 12th period, respectively.
Chart 3. on the right shows the historical trends of hotel occupancy rates and RevPAR. The occupancy rates have always been far exceeding macro indicators since our acquisition of hotel assets in the 5th period. The average occupancy rate for the 10th period was 89.7%.
RevPAR, an indicator of hotels’ profitability, continues to go strong, as the average for the 10th period was 131.4 based on the level for the 5th period set as 100. Just for your information, figures for the even number periods tend to be higher than those for the odd number periods, because of seasonal factors.
Please turn to the next page.
|
|
|