|
|
 |
|

|
|

|
|
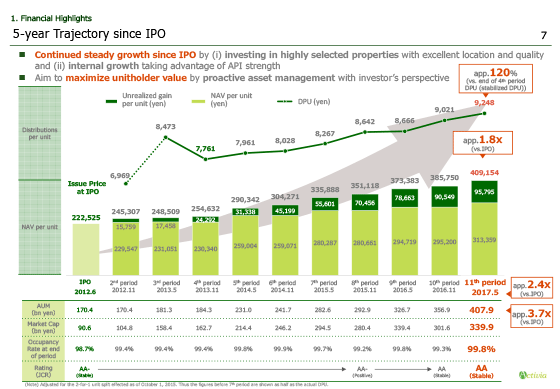
It has passed five years since we were listed in June 2012.
And this page shows you using various indicators our growth trajectory from the IPO.
First, at the end of the 11th period, distributions per unit, indicated by the green line at the top on the graph, grew to approximately 120% in approximately 3 and a half years compared to the end of the fourth period when the costs for property tax became normalized.
NAV per unit, indicated on the bar graph at the bottom, at the end of the 11th period, grew to approximately 1.8 times of the issue price at the IPO. This growth in NAV per unit was due to increase in unrealized gains resulting from PO and from increase of unrealized gain of our existing properties.
Looking at the table below the graph, AUM and the market cap for the 11th period were approximately 2.4 times and 3.7 times larger, respectively, compared to those at the IPO.
Moreover, the overall average occupancy rate at the end of each period has consistently stayed above 99% since the IPO, and our credit rating issued by JCR was upgraded to AA flat last year.
We aim to improve continuously unitholders value, with a focus on both growth and stability, through proactive management from the investor’s perspective.
|
|
|