The 11th Fiscal Period (May. 2017) Presentation


The 11th Fiscal Period (May. 2017) Presentation

Index

Major Topics for the 11th Period (ended May 2017)

Highlights of the 11th Fiscal Period (ended May 2017) and onwards

Financial Results for the 11th Period (ended May 2017)

External Growth

Internal Growth

Financing Strategy

(Reference) Financial Forecasts for the 12th Period (ending Nov. 2017) and the 13th Period (ending May. 2018)

Others

Disclaimer

一括ダウンロード

ディスクロージャー資料


前のページへ
次のページへ

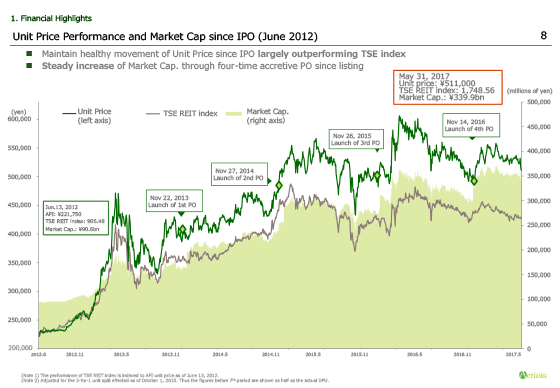
Page 8 shows the changes in unit price and market cap since the IPO.

First, let’s take a look at unit price indicated by the green line, and the TSE REIT index by the brown line. Unit price has been outperforming the TSE REIT index since from half year passed the IPO.

The market cap, indicated by the light green background color, is steadily increasing due to the rise in unit price and four times accretive equity offerings.

Please turn to the next page.