|
|
 |
|

|
|

|
|
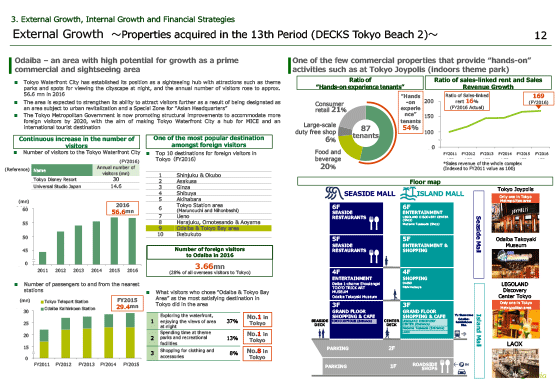
I would like to move on the growth potential of the Odaiba area and the summary of this property such as tenant structure.
First, let me refer to the trends of the number of visitors to the Tokyo Waterfront City.
The number of visitors to the area remained at 40 million over in 2011, though it is increasing year after year, and in 2016, 56.6 millions of people have visited the Tokyo Waterfront City area, which is approximately double that to Tokyo Disney Resort.
In the rankings of the most popular destinations amongst foreign visitors in Tokyo, this area is positioned 9th behind Harajuku, Omotesando and Aoyama area. In 2016, the estimated number of foreign visitors to this area was 3.66 million. A high demand from inbound tourists is one aspect that characterizes the area.
Next, please see the right side of the page.
This property is a large-scaled commercial property with total 87 tenants. And 54% of the tenants on the surface basis provide "hands-on experiences", including as major tenants, Tokyo Joypolis, LEGOLAND Discovery Center Tokyo and Madame Tussauds Tokyo.
The ratio of sales-linked rent is 16%, though the sales revenue of the whole complex shows an increasing trend, recording in FY2016 a revenue approximately 1.7 times larger than FY2011, proving that this retail property has further upside potential.
Please turn to the next page.
|
|
|