|
|
 |
|

|
|

|
|
From this page, I would like to explain internal growth, external growth and financial strategy. Let me start from internal growth.
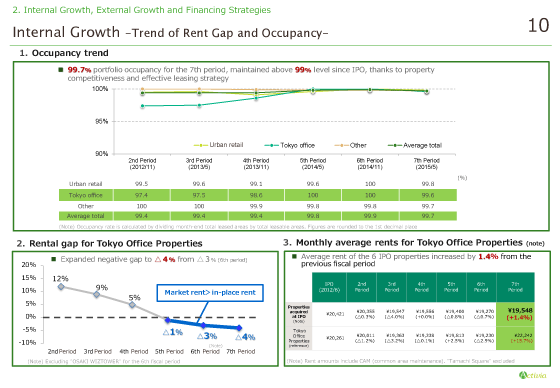
The top table NO.1 shows the occupancy rate for each property. At the end of the 7th period, the portfolio average occupancy rate was 99.7% with 99.8% of occupancy rate for Urban Retail Properties, 99.6% of occupancy rate for Tokyo Office Properties and 99.7% of occupancy rate of Other Properties.
The average occupancy rate in our portfolio has been maintained at a high level of above 99% since IPO. We will continue to maintain the high occupancy rate by utilizing leasing capability of Tokyu Fudosan Holdings Group.(rent base :UR:99.8%, TO:97.3%, O:99.7%, Total:99.2%)
The left table No.2 illustrates rent gap trends for Tokyo Office Properties.
Due to the leasing market recovery, the current rent gap is -4%, which is larger than that of the previous period.
The right table No.3 describes trends of average monthly rent for Tokyo office. The average rent for Tokyo Office Properties acquired at IPO has turned into recovery trends with +1.4% from the previous period.
|
|
|