|
|
 |
Next, let me explain Urban Retail Properties.
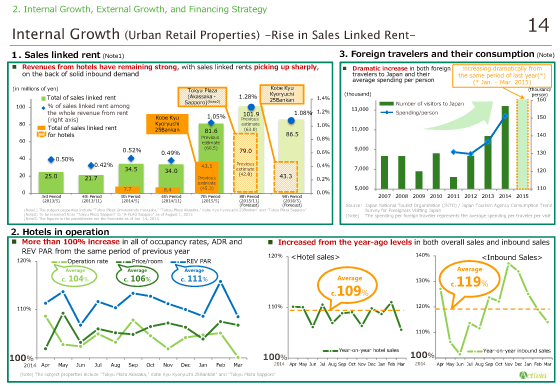
As you may know, the right graph NO.3 shows the number of visitors to Japan and demand from inbound visitors. Their demand is expected to increase more highly.
Given the good market circumstance, as the left graph No.1 shows, the sales linked rents in the 7th period from the tenants, including hotels, achieved ¥81.6 million which is 1.2 times as large as the previous forecast.
We estimate the total of sales linked rents in the 8th period to be ¥102 million, including ¥80 million from the hotels in Sapporo and Akasaka. In the 9th period, we estimate ¥87 million, including ¥43 million from the hotel in Kobe.
The chart below No2 illustrates the operation rate of hotels in good health.
The operation rate, average daily rate and RevPAR are over 100% compared with the previous period, and hotel sales and sales from inbound visitors are 109% and 119% respectively from the previous period.
Please turn over the page.
|
|
|