|
|
 |
First let me refer to our office properties.
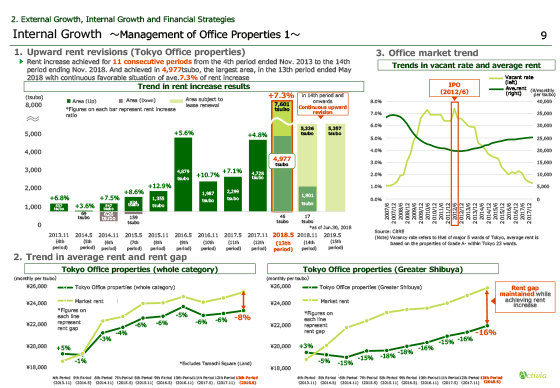
The graph on the upper left shows the rent revision results of Tokyo Office properties as of June 30, 2018. During the period ended May 2018, rent increased in 4,977 tsubo, the largest floor area ever, with an average increase rate of 7.3%.
The below graph on the left shows the average rents of total Tokyo Office properties with rent gap, and that of Tokyo Office properties located in Greater Shibuya area with rent gap on the right.
The average rent of our existing portfolio shown in dark green has continued to increase globally owing to steadily achieved upward rent revisions.
While, similar upward trend has been seen in the market rent, shown in light green, backed by favorable office market. Therefore, the rent gap which is the difference of the dark green line and the light green line remains at the same level. We aim to achieve further internal growth taking advantage of these negative rent gaps.
Please turn to the next page.
|
|
|